

Automated Trading Strategy #11
Automated Trading Strategy #11
Strategy 11 was first published in May of 2021, but we still use it today.
There is no guarantee that any strategy will have the same performance in the future. Some may perform worse and some may perform better. We use backtests to compare historical strategy performance. Backtests are based on historical data, not live data. There are no guarantees that this performance will continue in the future. Trading futures is extremely risky. If you trade futures live, be prepared to lose your entire account. We recommend using our strategies in simulated trading until you/we find the holy grail of trade strategy.
Strategy 11 was originally published in May of 2021. It was published with the following chart.

*See below for Column Definitions
At the time, we were testing it on a 36 range NQ data series. It made over $25K in a 12 month period and had profit factor of 1.05, which isn’t great, but shows a slight edge.
Today, we track Strategy 11 using two different data series: 1) 60 minute ZN (10 year note futures contract), and 2) 60 minute ZB (30 year T-bond futures contract). This is a chart showing how well both did in the September 2022 update.

What can I say about Strategy 11 from the Sept 1, 2021 to Sept 1, 2022 test period:
the 60 minute ZN has a profit factor of 1.16.
the 60 minute ZB has a profit factor of 1.12 and has been profitable for the last 3 weeks.
Both have a relatively low drawdown.
Both are on the Mudder Report so they’ve been tested for backtest accuracy using real-time data.
Neither drops below an account value of -$1K, but the annual profit is extremely low.
While we continue to track Strategy 11, the instruments we use will likely be replaced on the Mudder Report since they have such a low profit factor and net profit. That said, we will continue to look at (and track) other variations of Strategy 11. For example, I ran an optimization on Strategy 11 based on a minute data series from 1 to 60 for several futures contracts. These are the results (the first number in the parameters column in the data series):

The total portfolio has a net profit over $400K and a profit factor of 1.32. As you can see, GC has the best performance at 1.67 on 235 trades (57 minutes). Total net profit is higher than what we’re seeing from ZN and ZB combined.
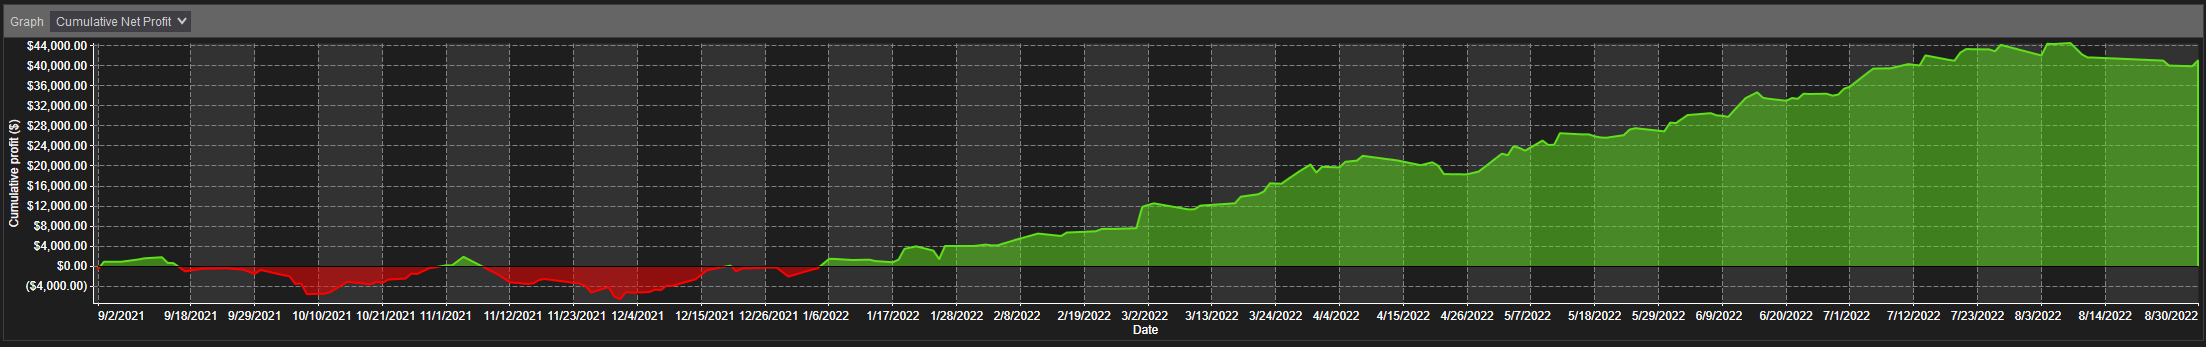
This is what the cumulative net profit of GC looks like over the last year.
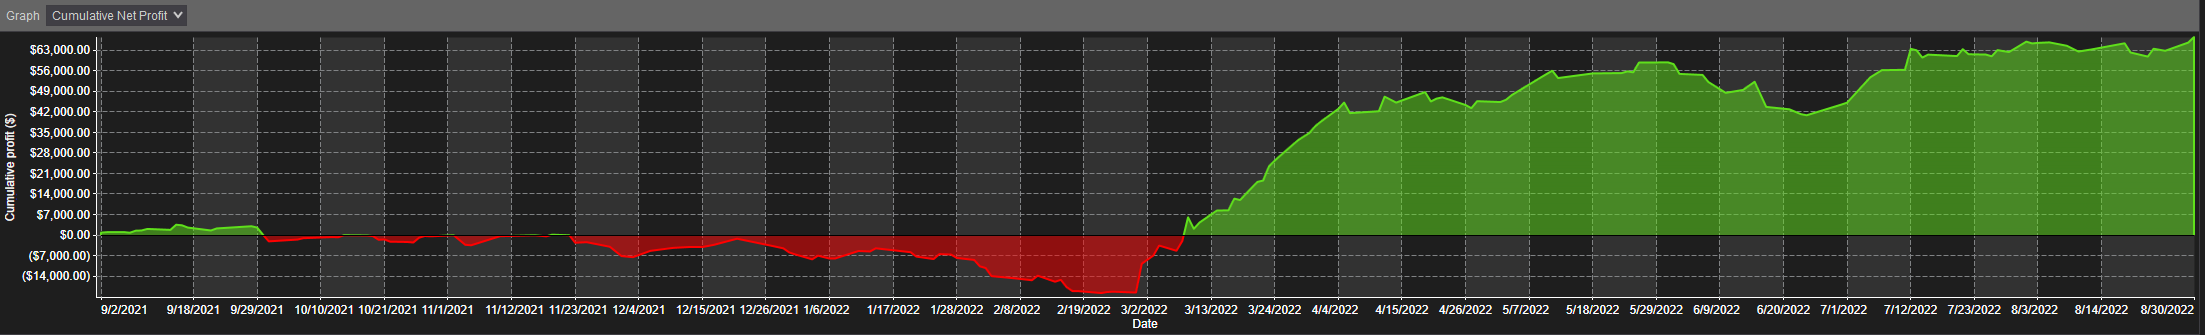
ES and CL also performed well, but have different cumulative net profit profiles. Here’s the profile for ES.

Here’s the cumulative net profit for CL:
Of all three charts, I like the chart for ES the best because it shows a steady trend upward.
Next week we’ll be publishing Strategy 12, which had an account value that never dropped below zero. That is, cumulative net profit was always positive from day 1. This is more about when you start the strategy rather than the merits of the strategy itself, but it’s worth noting.
Now, let’s get into how to recreate Strategy 11.