

Automated Trading Strategy #14
Automated Trading Strategy #14
Important: There is no guarantee that our strategies will have the same performance in the future. We use backtests to compare historical strategy performance. Backtests are based on historical data, not real-time data so the results we share are hypothetical, not real. There are no guarantees that this performance will continue in the future. Trading futures is extremely risky. If you trade futures live, be prepared to lose your entire account. We recommend using our strategies in simulated trading until you/we find the holy grail of trade strategy.
As a quick reminder, our goal is to find the holy grail of automated trade strategy as defined below:
Profit factor greater than 3
Annual drawdown less than 3%
Annual return on max drawdown greater than 500%
Maximum daily net loss of -$1,000
Avg Daily profit greater than $1,000
Less than 5,000 trades annually
More than 253 trades annually
We haven’t found the holy grail yet, but we get closer with every strategy.
When Strategy 14 was first published in June 4, 2021, this was the performance chart we published along with it:

At the time, we tested all strategies using a Range 36 data series. After a real-time test of one of our best strategies, we realized that Range as a data series is difficult for the simulation to handle. The result is large discrepancies between real-time and backtested results. By switching to a minute based chart, we’ve greatly reduced this risk.
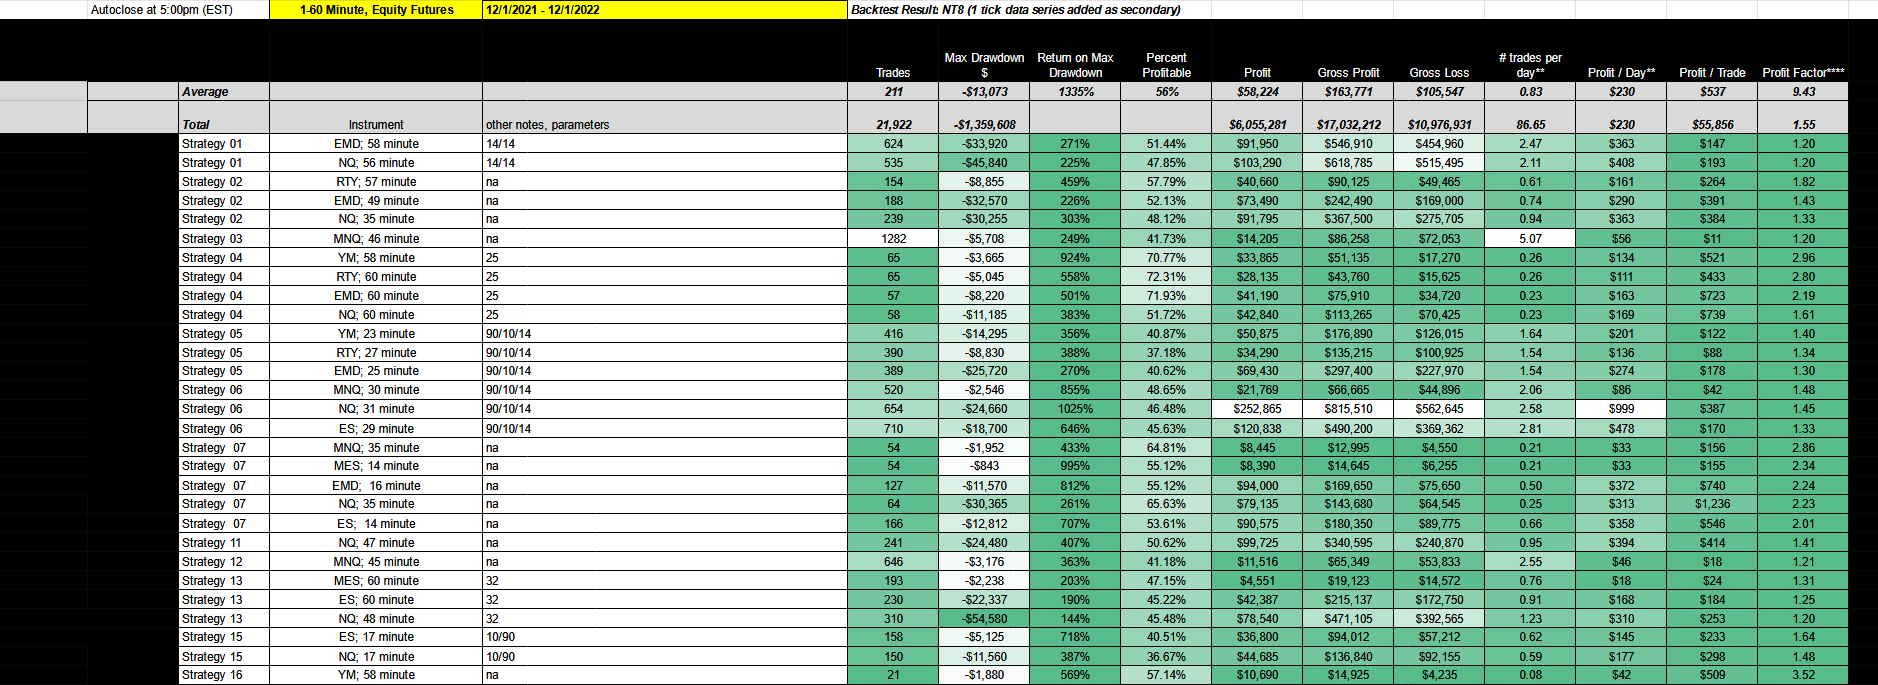
See below for the most recent minute-based performance chart, which provides:
the strategy,
the instrument to use for the strategy and the data series (all of our strategies are backtested on a minute-based data series from 1 - 60)
the parameters,
the trade count, and
the max drawdown.
The max drawdown is the cumulative drawdown, not absolute. In other words, it is the most the account balance has ever fallen from its high (not $0), which is why we use it to calculate return rather than absolute drawdown.
You’ll also find the percentage of profitable trades, net profit (broken down by gross profit and loss), along with a few stats like # of trades per day, profit per day, profit per trade and profit factor.
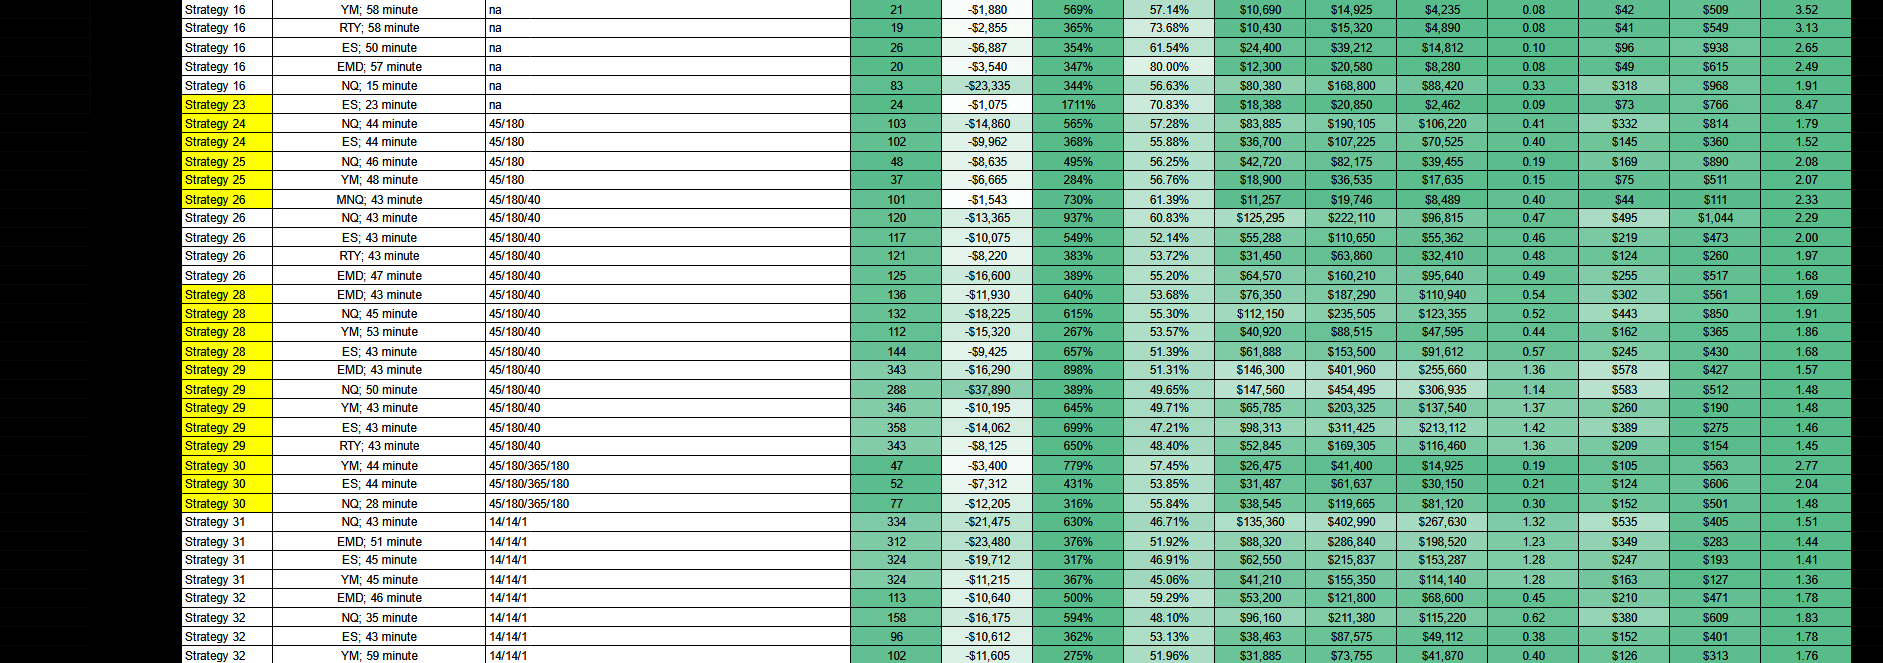
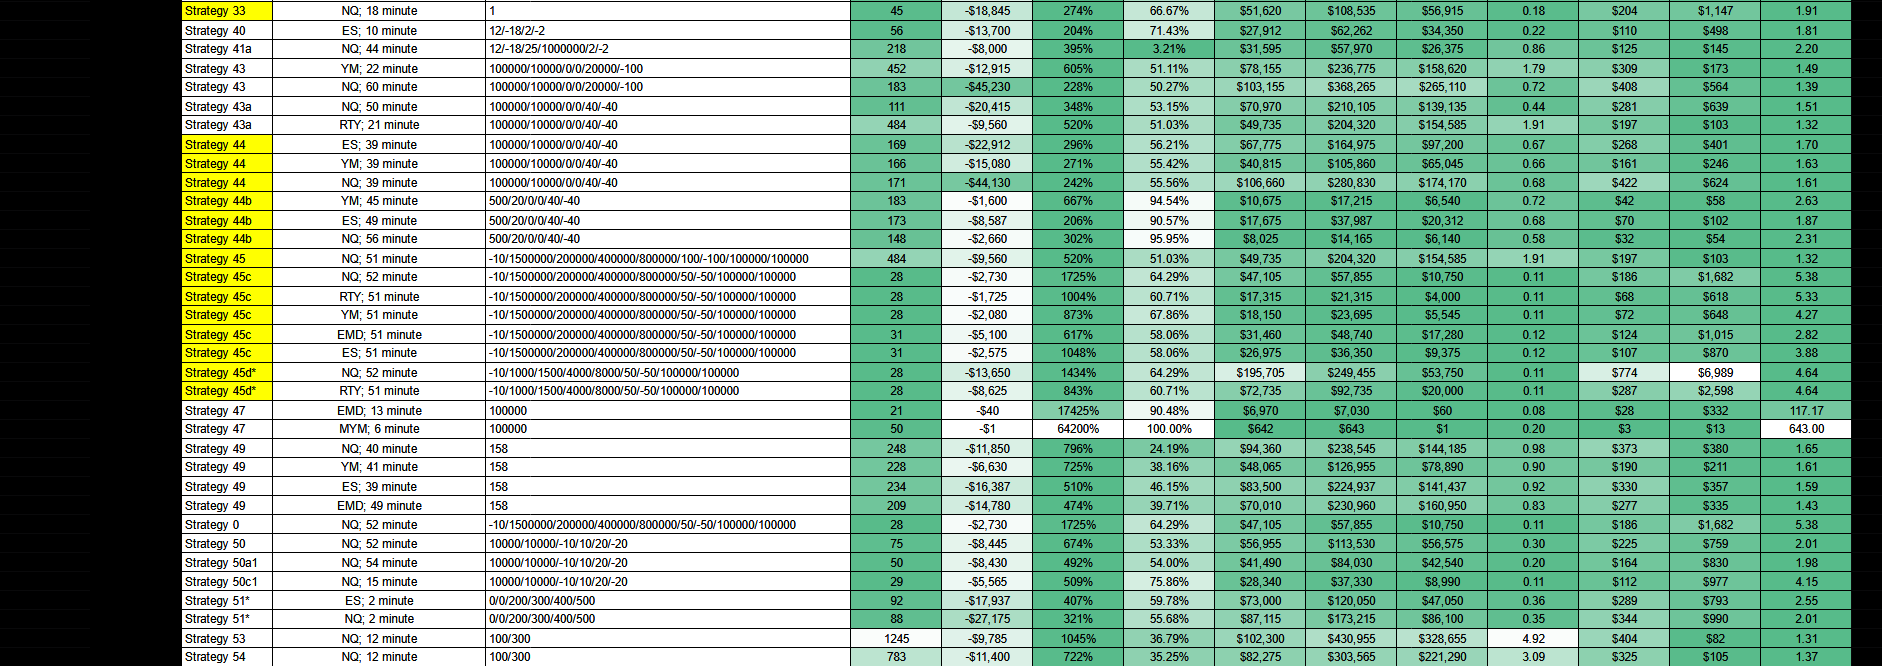
Today, we have over 50 strategies on ATS. Sometimes we have several variations of the same strategy. The performance chart below is meant to highlight our best variations based on backtest results from December 1, 2021 to December 1, 2022:
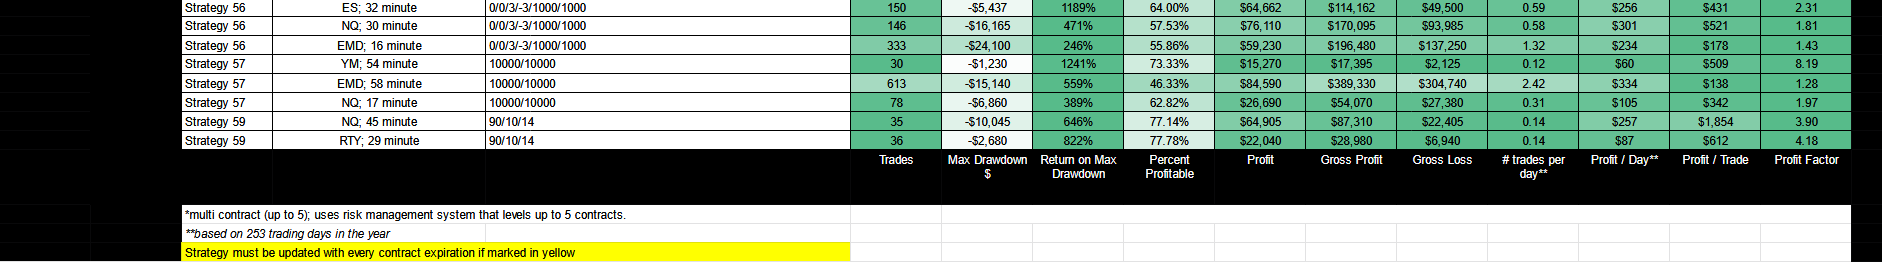
The first thing you’ll notice is that Strategy 14 did not make this chart. This is because the chart above is based on a 1 to 60 minute optimization. If you use a 60 to 120 minute optimization, however, you get the following performance:

MNQ, ES, MES, and NQ all have a decent performance. Use the first row in the parameters column as the minutes for the chart to duplicate results. For example, use the 80 minute chart for NQ, and a 119 minute chart for ES.