

Automated Trading Strategy #31 (ATS Mini)
Automated Trading Strategy #31 (ATS Mini)
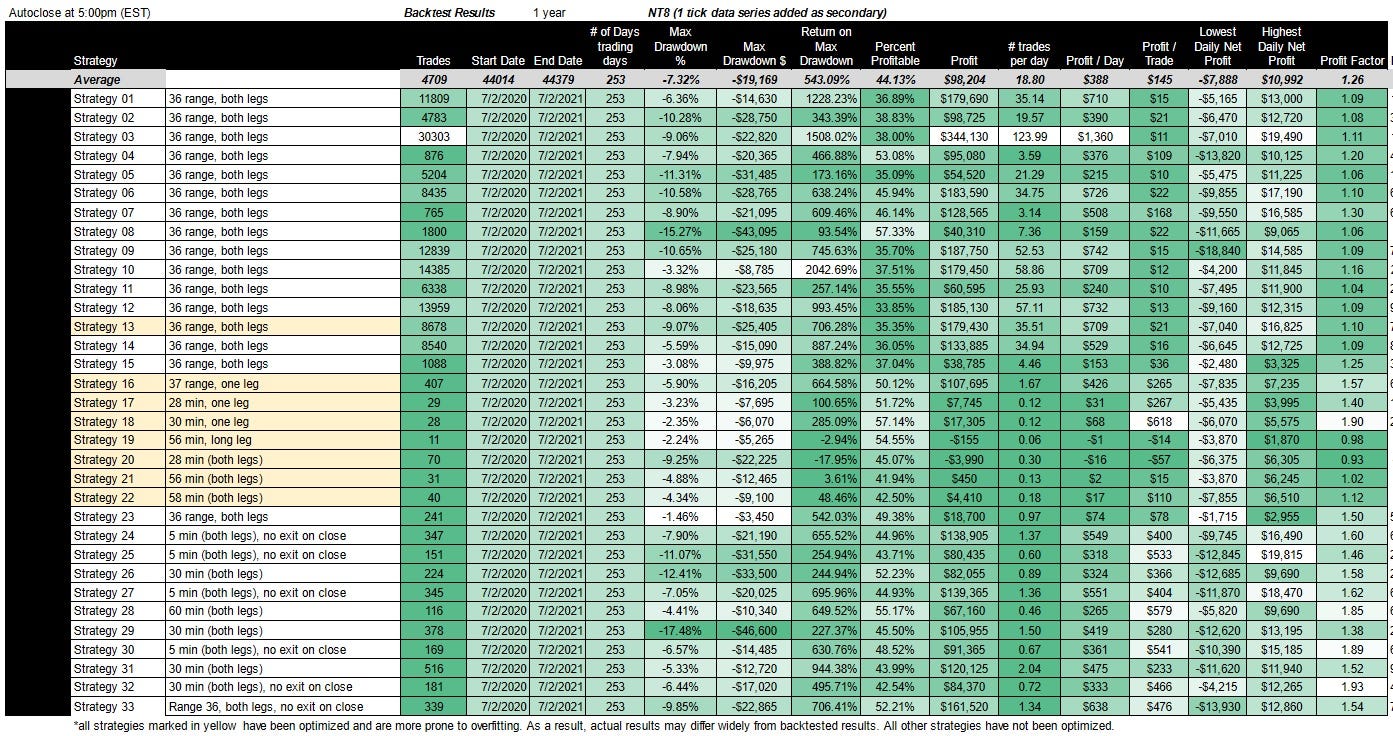
Strategy 31 made $120K in the last 12 months, makes $233 per trade and has a Profit Factor of 1.52.
There is no guarantee that these strategies will have the same performance in the future. Some may perform worse and some may perform better. We use backtests to compare historical strategy performance, but there are no guarantees that this performance will continue in the future. Trading futures is extremely risky. If you trade futures live, be prepared to lose your entire account. We recommend using our strategies in simulated trading until you/we find the holy grail of trade strategy.
Strategy 31 was originally published on ATS in September of 2021.
As a quick reminder, our goal is to find the holy grail of automated trade strategy as defined below:
Profit factor greater than 3
Annual drawdown less than 3%
Annual return on max drawdown greater than 500%
Maximum daily net loss of -$1,000
Avg Daily profit greater than $1,000
Less than 5,000 trades annually
More than 253 trades annually
We haven’t found the holy grail yet, but we get closer with every strategy. Click here for the most recent performance chart.
Strategy 31 was originally published on ATS in September of 2021. At the time, it made $120K annually, $233 per trade and had a Profit Factor of 1.52.
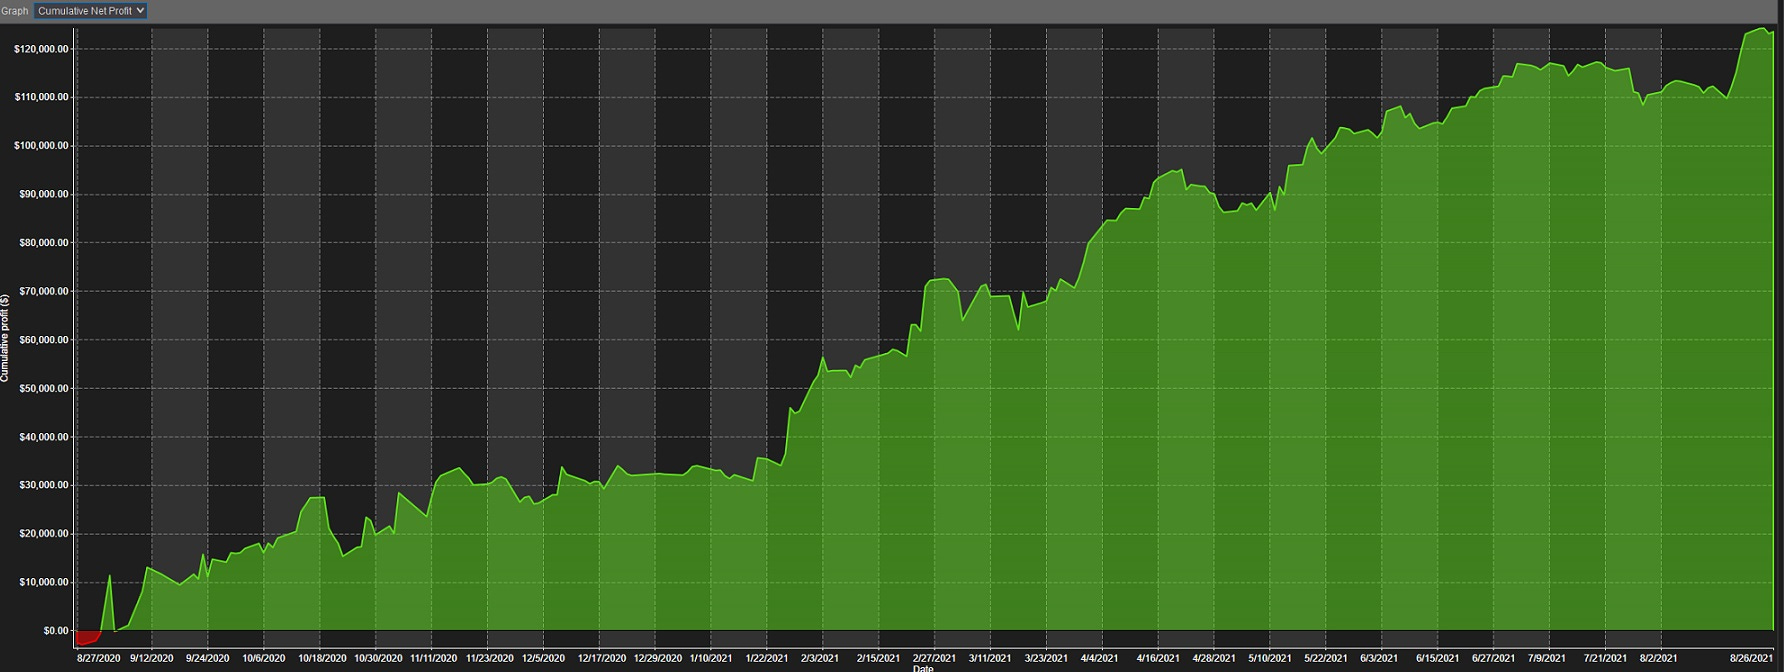
This was the original cumulative profit of Strategy 31 over a 1 year period. It has the profit profile we like to see — a slow and gradual growth pattern with few dips. It starts off with a slight dip below zero, reaching a cumulative low of only $85, but then continues to grow over zero from that point on. Max drawdown is therefore relatively low at 5.33% or $12,720.
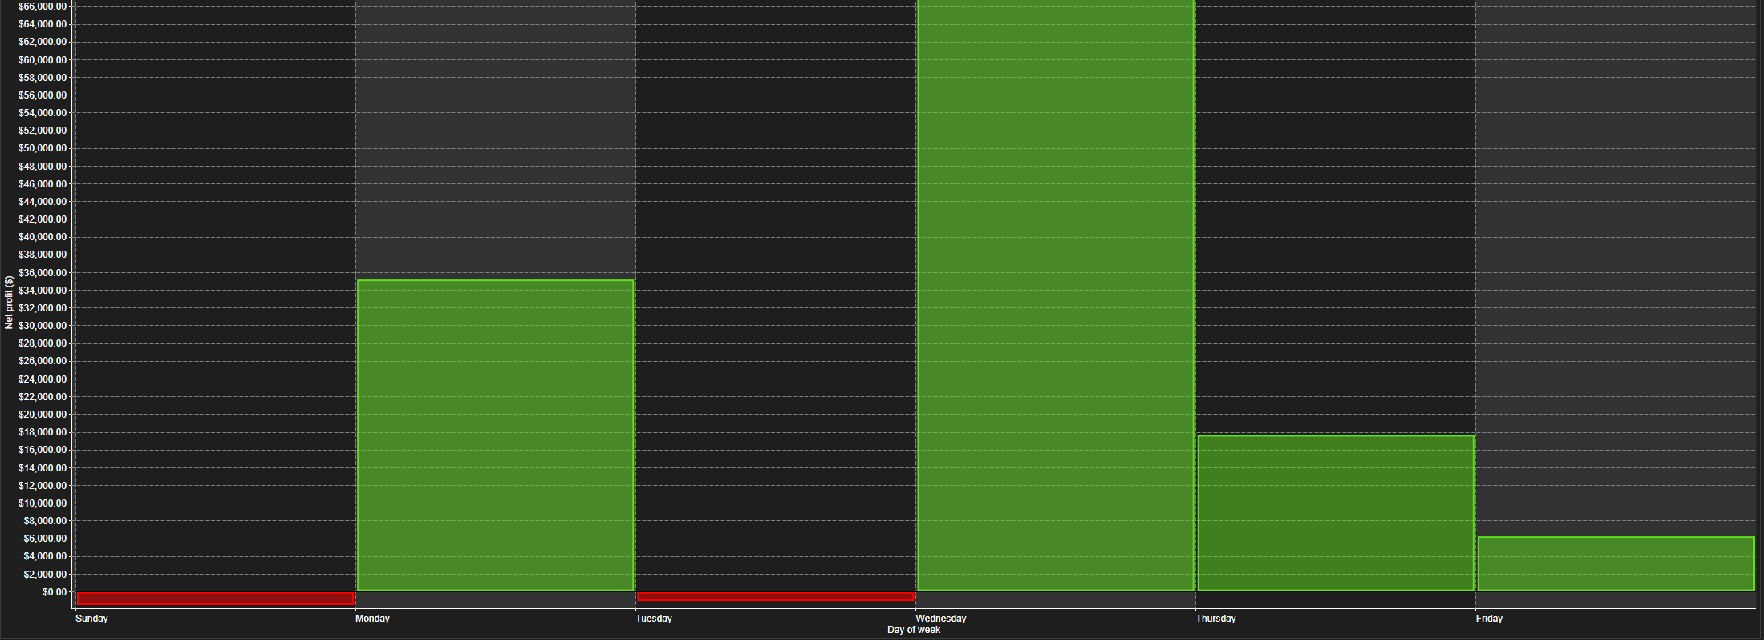
This is how the strategy broke down on a day-of-week basis. Wednesday was clearly the most profitable day followed by Monday.
Here’s the original performance chart:
The performance chart above covers the period from 7/2/2020 to 7/2/2021. We still track Strategy 31 today and in the last backtest from April 1, 2022 to April 1, 2023, Strategy 31 made $93K on 1 NQ contract, which equates to $309 per trade. It also has a profit factor of 1.46, which is slightly lower than it was in the original backtest. This might be due to a change in data series. When we originally ran Strategy 31, it was on a 30 minute chart. Today we run it on a 60 minute chart. Still, I think it’s safe to say that Strategy 31 is performing as expected with some degree of alpha decay.

For a link to all strategies and the most recent chart, click here.
Now let’s get into how to recreate the strategy for yourself.