

Automated Trading Strategy #33
Automated Trading Strategy #33
Strategy 33 was originally published in September of 2021.
Important: There is no guarantee that these strategies will have the same performance in the future. I use backtests to compare historical strategy performance. Backtests are based on historical data, not real-time data so the results shared are hypothetical, not real. There are no guarantees that this performance will continue in the future. Trading futures is extremely risky. If you trade futures live, be prepared to lose your entire account. I recommend using these strategies in simulated trading until you/we find the holy grail of trade strategy.
As a quick reminder, our goal is to find the holy grail of automated trade strategy as defined below:
Profit factor greater than 3
Annual drawdown less than 3%
Annual return on max drawdown greater than 500%
Maximum daily net loss of -$1,000
Avg Daily profit greater than $1,000
Less than 5,000 trades annually
More than 253 trades annually
We haven’t found the holy grail yet, but we get closer with every strategy. Click here for the most recent performance chart.
Strategy 33 was originally published on ATS in September of 2021. At the time, it was one of our best strategies. It made $159K in the annual backtest, which translates into $514 per trade. It also had a Profit Factor of 1.62.
Strategy 33 has functionality across different data series types (range, minute, tick and volume). The chart below shows how some of the most popular futures contracts performed based on a 1000 tick data series over a 1 year backtest period from 8/01/20 to 8/01/21.
(click to enlarge)
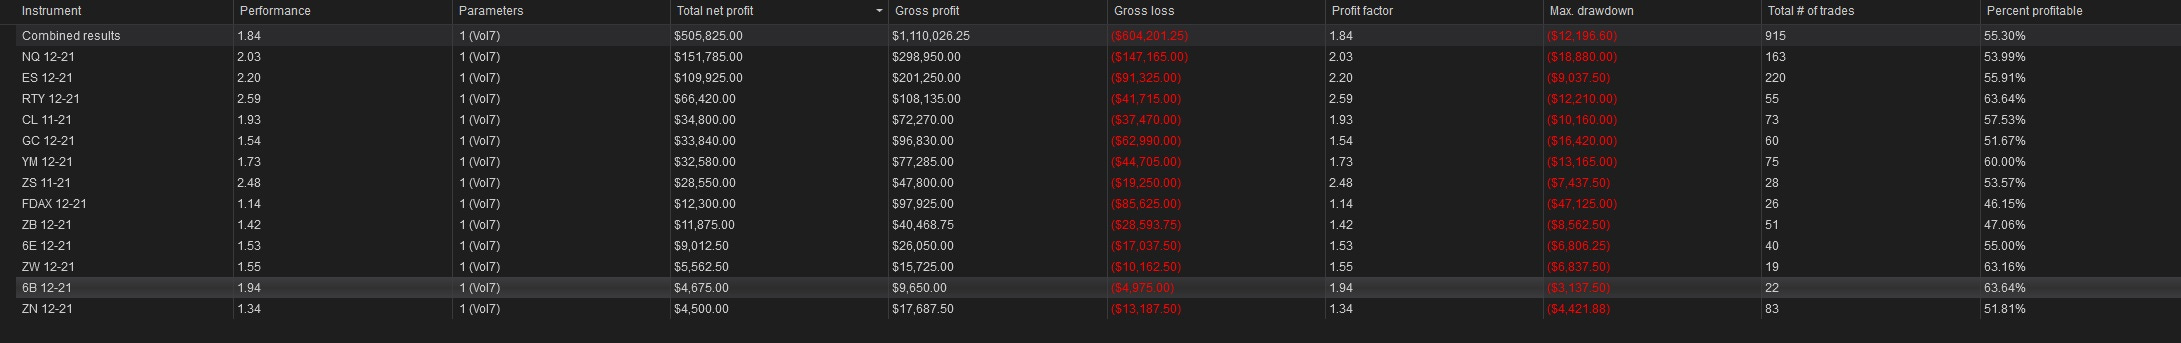
All futures contracts were net positive, which is highly unusual. Perhaps the biggest surprise is RTY, with a net profitability of $66K and a profit factor of 2.59. ES also had an amazing profile with a net profitability of $109K and a profit factor of 2.20.
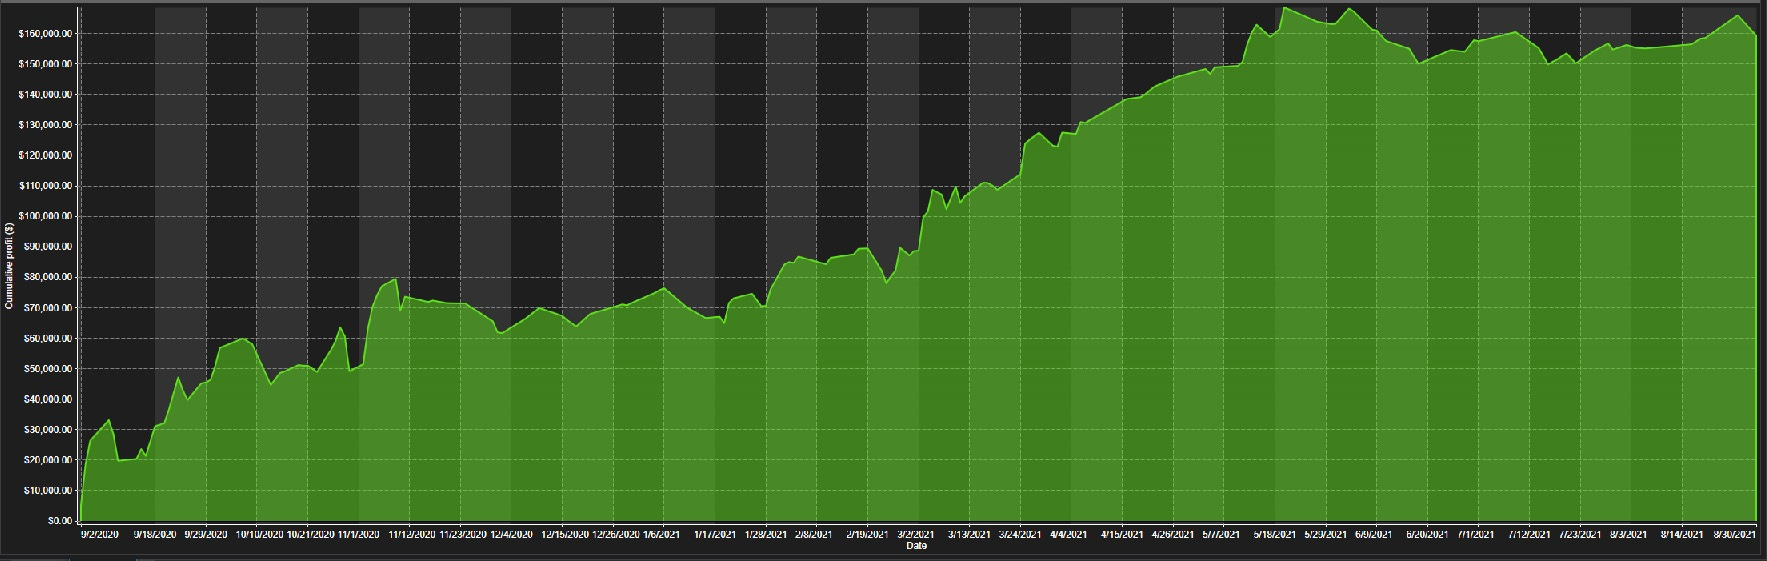
This was the cumulative profit of Strategy 33 over a 1 year period. It never falls lower than $5,150, but this is due to timing more so than anything else. Still, it has a profit factor of 1.62, which means that the ratio of gross profit to loss is 1.62. In other words, the strategy made 1.62 times more money than it lost during the period.
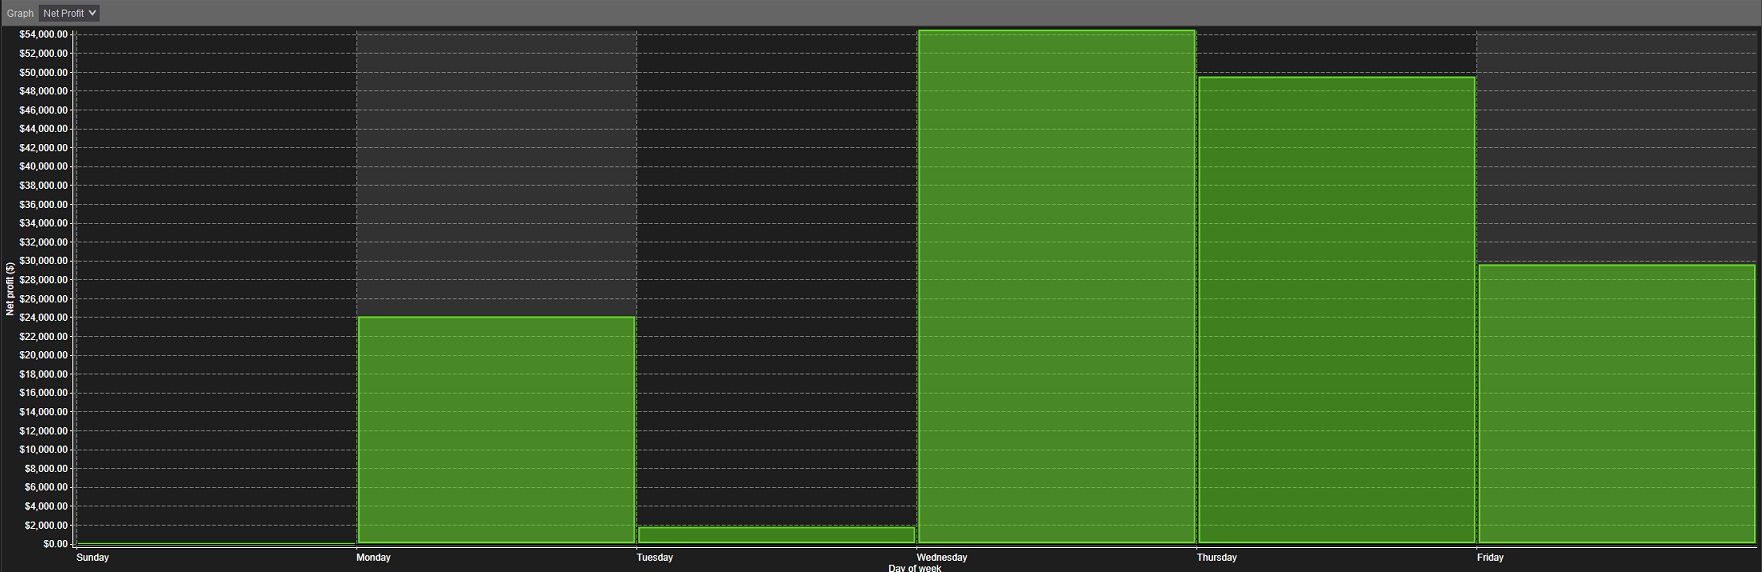
This is how the strategy breaks down on a day-of-week basis. This chart can help with determining the best time to get into a strategy. Wednesday looks like the best day to enter.
For links to all strategies click here.
Now let’s get into how to recreate and/or download Strategy 33 for yourself.