

Automated Trading Strategy #7
Automated Trading Strategy #7
Strategy #7 made over $170K last year on one FDAX contract.
There is no guarantee that these strategies will have the same performance in the future. Some may perform worse and some may perform better. We use backtests to compare historical strategy performance, but there are no guarantees that this performance will continue in the future. Trading futures is extremely risky. If you trade futures live, be prepared to lose your entire account. We recommend using our strategies in simulated trading until you/we find the holy grail of trade strategy.
Backtest Results based on 1 year of trades

As a quick reminder, our goal is to find the holy grail of automated trade strategy as defined below:
Profit factor greater than 3
Annual drawdown less than 3%
Annual return on max drawdown greater than 500%
Maximum daily net loss of -$1,000
Avg Daily profit greater than $1,000
Less than 5,000 trades annually
More than 253 trades annually
Every two weeks we introduce another strategy. Today, we’re introducing Strategy 7 on ATS Mini and Strategy 52 on ATS.
One thing ATS Mini subscribers are getting over ATS subscribers is the benefit of hindsight. So, I can tell you how this strategy has evolved since we first published it 20 months ago and provide a few other ways to improve its performance.
When we first started using Strategy 7, it was with a 36 range data series. While range is an ideal data series for visualization, it is difficult for the backtest engine to calculate accurately. As a result, range based backtests tend to be less accurate than minute-based data series. This is also the case for Renko. So, in May of 2022, we made the switch to minute-based data series. In particular, we reran all strategies to see which minute-based data series performed the best. From a net profit perspective, FDAX (DAX futures) performed the best with Strategy 7. It had a net profit of $173K and profit factor of 1.40 on just over 1000 trades. This performance is based on a 1 minute data series.
A strategy that produces a net profit of 173K is great, but a profit factor of 1.40 is low based on our goals. We’re looking for a profit factor of at least 3. In other words, we’re looking for a strategy that makes 3x more gross profit than loss. What if we analyzed Strategy 7 by looking at the futures contract with the highest profit factor? We conducted that analysis and this is what we found:
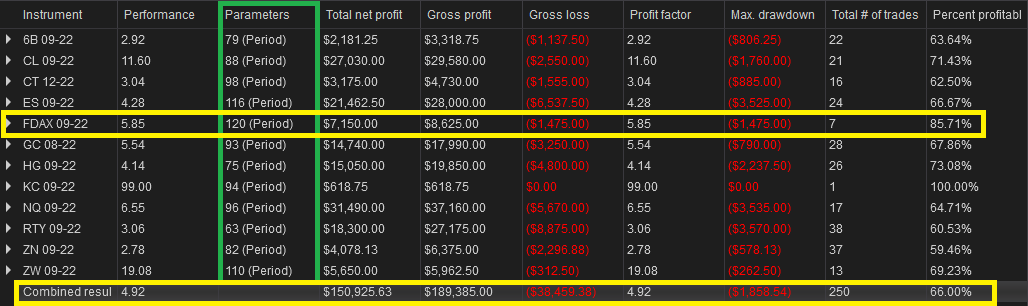
The parameters column (green box) shows the best minute based data series to use with Strategy 7 based on various instruments. As you can see, FDAX has the highest performance, with over 85% of trades being profitable. This is based on a 120 minute data series. Unfortunately, however, it only makes $7K on 7 trades throughout the year. One way to increase your trade count/net profit is to trade another contract like RTY (E-Mini Russell 2000) or NQ (E-Mini NASDAQ) on the same strategy. Both have a much higher net profit while maintaining a high profit factor, but you’re still working with less than 100 trades for the year. One way to boost trade count over 200 is to use the strategy on multiple contracts as a portfolio.
If you were to trade all 12 contracts listed above, the total number of trades increases to 250, net profit increases to $151K and profit factor remains high at 4.92. This means that gross profit is 4.92 higher than gross loss, which is ideal. Not only that, but average drawdown across strategies is less than $2K and 66% of the trades made are profitable.
Now, let’s look at how to recreate Strategy 7.
The beauty of this strategy is in its simplicity. At the end, I’ll also provide a download (C#). Remember, you can test all strategies by duplicating our backtest results above and if you need help, just send me an email. For links to all strategies available within the ATS Mini subscription, click here. For links to all strategies available within the ATS subscription, click here.